
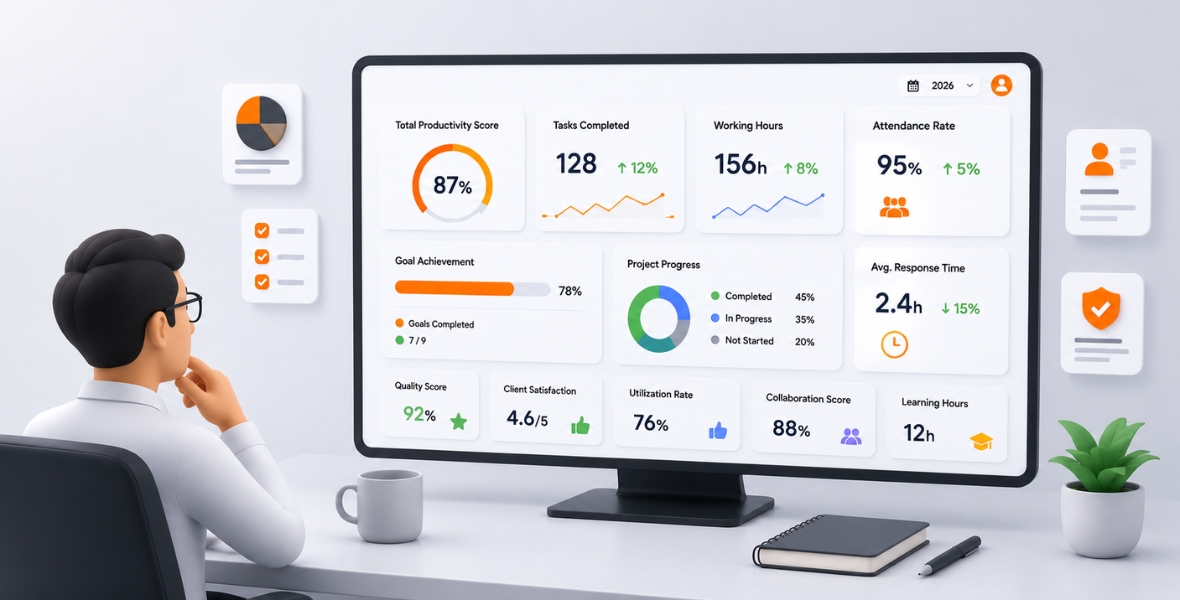
Employee productivity metrics are numbers that show how well people turn time, skills and resources into useful work. The most useful ones include output per employee, task completion rate, time utilization, quality score, goal achievement and billable hours. No single metric works for every team, so pick a few that match each role and read them together.
In simple terms, productivity measurement answers one practical question: how well is a person or team turning available resources into useful results? A factory might measure units made per employee. A software company might look at finished tasks, delivery time and quality. A service firm might track billable hours and utilization.
Good KPI tracking depends on job duties, team goals, industry and business objectives. This guide explains 25 employee productivity metrics every manager should know, with formulas, examples and tips. It also shows common mistakes and how software can help. For remote teams, see our guide on how to track the productivity of remote employees.
What is the difference between productivity and performance?
Productivity looks at the link between resources and output. Performance is broader. Employee performance metrics may also cover quality, behavior, skills, goals, leadership, teamwork and long-term contribution.
For example, someone may finish 50 tasks in a month. That is output. But if 20 of those tasks have serious errors, high productivity numbers don't mean strong performance.
| Area | Productivity metrics | Performance metrics |
|---|---|---|
| Main focus | Efficiency and output | Overall contribution |
| Measures | Time, output, utilization | Quality, skills, goals and behavior |
| Common example | Tasks finished per hour | Performance rating |
| Best use | Improving operations | Managing performance |
| Typical data source | Time and task tracking tools | HR reviews and manager input |
Quick summary: Productivity metrics measure efficiency and output. Performance metrics look at a person's wider contribution. Use both to get an accurate picture.
Why do productivity metrics matter?
Many managers now lead people who work in offices, at home, in coworking spaces and in other countries. Watching people work is no longer a reliable way to manage. Workforce data gives a more consistent view of how work is going.
They support data-driven decisions
Without data, managers can mistake visibility for productivity. Someone who posts a lot of updates may look busy, while a quieter colleague finishes important work early. Metrics let managers compare real outcomes, not impressions.
They improve profitability
Productivity affects costs, project margins and resource use. When you understand output, utilization, revenue per employee and profit per employee, you can find waste and fix it.
They improve conversations
Data makes feedback specific. Instead of saying "work harder," a manager can point to a clear issue, such as fewer finished tasks or rising overtime. That makes reviews fairer and easier to act on.
They improve resource planning
Metrics show which teams are overloaded and which have room. That supports hiring, project planning and fair workloads.
They reduce burnout risk
High activity isn't always healthy. Repeated overtime, falling quality, more absences and missed deadlines can signal a workload problem. Several metrics together show the warning signs early.
Expert tip: Never judge someone on one metric. Productivity has many sides. Combine output, quality, time, engagement and business results for a balanced view.
What are the 25 employee productivity metrics every manager should track?
This table gives a quick overview. Details, formulas and examples follow below.
| KPI | What it measures | Best for |
|---|---|---|
| Output per employee | Work produced | Operations |
| Task completion rate | Assigned tasks finished | Project teams |
| Time utilization rate | Productive use of time | Knowledge workers |
| Attendance rate | Presence on scheduled days | All businesses |
| Absenteeism rate | Unplanned absence | HR teams |
| Engagement score | Connection to work | HR |
| Revenue per employee | Revenue efficiency | Leadership |
| Billable hours | Time charged to clients | Agencies |
| Average task duration | Time per task | Operations |
| Project completion rate | Projects delivered | Project teams |
| Quality score | Work quality | All teams |
| Customer satisfaction | Customer experience | Service teams |
| Goal achievement rate | Goals met | All teams |
| Sales productivity | Sales results | Sales teams |
| Training completion | Learning finished | HR |
| Error rate | Mistakes in work | Operations |
| Overtime hours | Extra working time | HR and managers |
| Schedule adherence | Following schedules | Shift teams |
| Employee turnover | Staff retention | HR |
| Project completion time | Delivery speed | Project teams |
| Utilization rate | Capacity used | Service firms |
| Profit per employee | Profit efficiency | Leadership |
| Productivity growth | Change over time | Management |
| Performance rating | Overall performance | HR |
| Overall productivity index | Combined score | Executives |
1. Output per employee
Output per employee measures how much work one person produces in a set period. It gives a basic view of productivity and works best when output is easy to count.
Formula: total output ÷ number of employees
Benchmark: There is no universal number. Compare with your own history or similar roles.
How to improve: Remove bottlenecks, automate repeated tasks, clarify priorities and give people the right tools.
Example: A support team of 10 resolves 3,000 tickets. Output per employee is 300 tickets.
2. Task completion rate
Task completion rate is the share of assigned tasks finished in a period. It shows how well workload is planned.
Formula: completed tasks ÷ assigned tasks × 100
How to improve: Set realistic deadlines, make ownership clear and limit work in progress. Steady improvement matters more than a fixed target.
Example: Someone finishes 42 of 50 assigned tasks. The rate is 84%.
3. Time utilization rate
Time utilization shows how much available working time goes to productive work. It is one of the most practical ways to find wasted time.
Formula: productive hours ÷ available working hours × 100
Benchmark: Don't expect 100%. Meetings, breaks, learning and admin are part of work.
How to improve: Cut unneeded meetings, set clear priorities and automate repeated work.
Example: Someone has 40 available hours and spends 30 on productive work. Utilization is 75%.
4. Attendance rate
Attendance rate shows how consistently people work on scheduled days. Reliable attendance supports planning, customer service and steady operations.
Formula: days attended ÷ scheduled workdays × 100
How to improve: Use clear policies and look into repeated problems fairly. Set targets based on your own rules and local law.
Example: Someone works 21 of 22 scheduled days. Attendance is 95.45%.
5. Absenteeism rate
Absenteeism rate measures absence during scheduled work time. Rising absence can hurt output and overload others.
Formula: absent workdays ÷ total scheduled workdays × 100
How to improve: Look for workplace issues, review workloads, support well-being and keep leave rules clear. Compare departments and trends, not one global number.
Example: A department records 15 absent days out of 500 scheduled days. The rate is 3%.
6. Employee engagement score
Engagement score measures how connected, motivated and committed people feel. Engaged people share ideas, communicate well and support team goals.
How to improve: Give useful feedback, recognize good work, communicate clearly and offer growth chances. Use the same survey method each time.
Example: A quarterly survey shows falling trust in management updates. Leaders start monthly team updates and track the change.
7. Revenue per employee
Revenue per employee shows how much revenue the business makes relative to its size. Leaders use it to judge efficiency and growth potential.
Formula: total revenue ÷ average number of employees
How to improve: Improve processes, build skills, strengthen sales and automate slow workflows. Compare only with similar businesses.
Example: A company makes $5 million with 50 employees. Revenue per employee is $100,000.
8. Billable hours
Billable hours are working time you can charge to clients. Agencies, consultants, law firms and other service businesses depend on them for revenue.
How to improve: Cut excess admin and assign project work better. The right target depends on the role.
Example: A consultant works 160 hours and records 120 billable hours.
9. Average task duration
Average task duration is the typical time needed to finish a task. It helps with estimates and workload planning.
Formula: total task time ÷ number of completed tasks
How to improve: Standardize processes, train people and fix repeated bottlenecks. Compare similar tasks over time.
Example: Ten tasks take 30 hours. The average is three hours.
10. Project completion rate
Project completion rate is the share of planned projects finished successfully. It shows whether plans turn into results.
Formula: completed projects ÷ planned projects × 100
How to improve: Define scope better, plan resources and track milestones. Consider project complexity too.
Example: A team finishes 18 of 20 planned projects. The rate is 90%.
11. Quality score
Quality score checks whether finished work meets set standards. Output without quality leads to rework and extra cost.
How to improve: Write clear quality rules for each role, strengthen reviews and study repeated defects.
Example: Reviewers rate 94 of 100 finished orders as meeting standards. The quality score is 94%.
12. Customer satisfaction
Customer satisfaction shows how customers rate their experience. High internal activity means little if customers get poor service.
How to improve: Review feedback, improve response processes and train for each role. Use the same survey method over time.
Example: Satisfaction drops after response times rise. Managers rebalance workloads to improve coverage.
13. Goal achievement rate
Goal achievement rate is the share of set goals that a person or team meets. It links daily work to strategy.
Formula: goals achieved ÷ total goals × 100
How to improve: Set clear, measurable goals and review progress often. Targets should reflect how hard each goal is.
Example: Someone meets eight of ten quarterly goals. The rate is 80%.
14. Sales productivity
Sales productivity shows how well salespeople turn time and resources into sales. Measures include revenue, qualified opportunities, closed deals and conversion rate. It helps leaders tell activity apart from results.
How to improve: Improve lead quality, cut admin and strengthen training. Compare similar territories and roles.
Example: One rep makes fewer calls than colleagues but closes more qualified deals. Outcome metrics show stronger productivity.
15. Training completion rate
Training completion rate is the share of assigned training that people finish. Training builds skills, supports compliance and lifts long-term performance.
Formula: completed training ÷ assigned training × 100
How to improve: Set deadlines, give people time to learn and keep training relevant.
Example: 90 of 100 assigned employees finish a course. Completion is 90%.
16. Error rate
Error rate is the share of finished work that contains mistakes. A rising rate can point to rushed work, weak processes, training gaps or too much workload.
Formula: number of errors ÷ total output × 100
How to improve: Find root causes instead of just demanding fewer mistakes.
Example: A team processes 2,000 records and finds 20 errors. The error rate is 1%.
17. Overtime hours
Overtime hours are time worked beyond the standard schedule. Occasional overtime can help with urgent work. Constant overtime points to capacity problems or poor planning.
How to improve: Review staffing, workload, deadlines and slow workflows. Follow local employment laws.
Example: A development team's overtime rises three months in a row. Managers find that project estimates were unrealistic.
Manager tip: Never celebrate rising overtime without knowing why. More hours don't automatically mean more output.
18. Schedule adherence
Schedule adherence shows how closely people follow their assigned schedules. It is most useful for support, operations and shift teams.
Formula: time following schedule ÷ scheduled time × 100
How to improve: Build practical schedules and set realistic targets.
Example: Someone follows the schedule for 36 of 40 hours. Adherence is 90%.
19. Employee turnover rate
Turnover rate is the share of employees who leave in a period. High turnover hurts productivity, raises hiring costs and loses knowledge.
Formula: employees who left ÷ average number of employees × 100
How to improve: Study exit feedback, manager quality, pay, workload and growth options. Compare by role, department and voluntary versus involuntary exits.
20. Project completion time
This metric measures the time from project start to finish. It affects capacity, customer expectations and profit.
How to improve: Define scope clearly, plan milestones and allocate resources well. Compare similar projects only.
Example: Similar projects used to take 60 days. After process changes, they take 48 days on average.
21. Utilization rate
Utilization rate shows how much available capacity goes to defined productive or revenue-earning work. Service businesses use it to balance capacity and demand.
Formula: utilized hours ÷ available hours × 100
How to improve: Assign work better and reduce admin overhead. Targets vary a lot by role.
22. Profit per employee
Profit per employee measures profit relative to team size. Unlike revenue per employee, it accounts for costs.
Formula: net profit ÷ average number of employees
How to improve: Work more efficiently, control costs and focus people on valuable work.
23. Productivity growth rate
Productivity growth shows how productivity changes between periods. One number has little context; growth shows direction.
Formula: (current productivity minus previous productivity) ÷ previous productivity × 100
How to improve: Measure the effect of process changes and repeat what works. Steady gains beat short spikes.
24. Performance rating
A performance rating sums up someone's performance against set criteria, such as goals, quality, skills and teamwork.
How to improve: Train managers, define criteria clearly and combine feedback with data. Use a clear, consistent framework.
25. Overall productivity index
An overall productivity index combines several metrics into one weighted score. It helps leaders follow trends without relying on one KPI.
Example formula: (output score × 30%) + (quality × 25%) + (goal achievement × 25%) + (time efficiency × 20%)
How to improve: Find which part pulls the score down. Build an internal baseline and measure against it.
Example: A team has strong output but falling quality. The index shows the imbalance.
Tip: Keep the index simple. Mixing 20 unrelated numbers into one score makes it hard to read.
How do employee productivity metrics differ from performance metrics?
| Comparison | Productivity metrics | Performance metrics |
|---|---|---|
| Main question | How efficiently is work done? | How well is the person performing? |
| Focus | Output and efficiency | Overall contribution |
| Data | Mostly numbers | Numbers and judgment |
| Examples | Utilization, task duration | Skills, goal achievement |
| Time frame | Daily to quarterly | Usually monthly to yearly |
| Main users | Operations and managers | HR and leadership |
Productivity data helps improve work processes. Performance management helps people and the business grow over time. The strongest approach uses both.
Which productivity metrics fit each team?
| Team | Recommended metrics | Main goal |
|---|---|---|
| Sales | Revenue, conversion, goal achievement | Revenue growth |
| Customer support | Task completion, quality, satisfaction | Good service |
| Development | Task duration, project completion, quality | Reliable delivery |
| HR | Attendance, turnover, engagement | Healthy workforce |
| Agencies | Billable hours, utilization, profit | Client profitability |
| Operations | Output, errors, schedule adherence | Efficiency |
| Remote teams | Goal achievement, task completion, time utilization | Productive distributed work |
Common mistake: Don't copy another department's KPIs. A metric that fits sales may be useless for developers or HR.
What mistakes should you avoid when measuring productivity?
- Measuring hours instead of outcomes: Long hours don't mean high productivity. Combine time with finished work and quality.
- Tracking too many metrics: Dozens of unrelated KPIs create noise. Pick ones tied to business goals.
- Using one KPI for everyone: Roles differ. Build a framework for each role.
- Ignoring quality: High output with many errors raises costs.
- Comparing unrelated roles: A designer's task count and a support agent's tickets can't be compared.
- Using tracking as surveillance: Monitoring needs a clear purpose and open rules.
- Ignoring context: Outages, staff shortages and complex projects affect numbers.
- Setting unrealistic targets: Aggressive targets push people to rush and cut quality.
- Ignoring feedback: Metrics show what happened; people can explain why.
- Not acting on data: Every KPI should lead to a management action.
What are the best practices for tracking productivity metrics?
- Start with business goals. If project profit matters most, track utilization, billable hours, project time and profit per employee.
- Define every metric clearly, so everyone knows how it is calculated.
- Build a baseline from your own history before you set targets.
- Review regularly, but don't react to every daily change.
- Combine numbers with conversations and context.
- Be open about tracking, protect the data and limit who can see it.
- Look at trends, not single numbers, and always link metrics to improvement.
Quick summary: Good productivity measurement is open, role-specific, focused on outcomes and tied to decisions. The goal is better work systems, not more data.
Should you track productivity manually or with software?
| Area | Manual tracking | Productivity software |
|---|---|---|
| Time records | Spreadsheets | Tracked as people work |
| Reports | Manual math | Ready-made reports |
| KPI visibility | Limited | Dashboard |
| Analysis | Slow | Built-in trends |
| Growth | Hard to scale | Suits growing teams |
| Live view | Usually none | Live status |
Manual tracking may work for a very small team. As you grow, spreadsheets get hard to maintain, and data ends up scattered across many places. Software brings time and task data together and cuts repeated reporting work.
How does employee productivity software help?
Productivity software helps managers collect, organize and analyze work data. The goal is not to watch people. A good system shows how time is used, how tasks progress and where workload is uneven. TimoDesk supports several of the metrics above.
Time tracking
People start the timer on a task in the TimoDesk desktop app, and time is recorded in the background. Idle time is removed on its own. That gives you real data for time utilization, average task duration and billable hours. Learn more about time tracking.
Tasks and estimates
Tasks have due dates and estimates, and TimoDesk flags a task when tracked time goes over its estimate. That supports task completion rate, project completion time and better future estimates.
Activity levels and app usage
Activity level is the share of tracked time with keyboard or mouse input. TimoDesk never records what anyone types. App and website usage shows where tracked time goes. Use both as context, not as a score on their own.
Dashboard and alerts
The team dashboard shows key figures with trends, Time Allocation and a Performance Map. Its Action Center flags overdue tasks, low-activity members, long workdays and tasks over estimate, which helps you spot overtime and burnout risks early.
Leaderboards and reports
Top and low performer lists and a monthly performance leaderboard help you recognize strong work. Reports download as PDF or CSV, and monthly timesheets as PDF.
Expert tip: Software should support a manager's judgment, not replace it. Data shows patterns. Managers find the reasons and decide what to do.
Why do businesses choose TimoDesk?
| TimoDesk area | Metrics it supports |
|---|---|
| Time tracking on tasks | Time utilization, billable hours, average task duration |
| Task estimates and due dates | Task completion, project completion time |
| Activity levels and app usage | Context for utilization and focus |
| Action Center | Overtime and workload warning signs |
| Leaderboards and reports | Productivity growth and recognition |
TimoDesk has no attendance, HR or payroll features, so metrics like attendance, turnover and engagement come from your HR tools. For time and task metrics, it gives office, remote and hybrid teams clear data for $1 per user per month. See the pricing page.
Final thoughts
Employee productivity metrics show how people, time and resources turn into results. The key is not tracking every number. Choose metrics that match real job duties and business goals, and read output, time, quality and engagement together. A KPI can show a trend, but it doesn't always explain it, so combine data with conversations and judgment. TimoDesk helps with the time and task side of that picture. Start a 15-day free trial with no card needed.
Frequently asked questions
What are employee productivity metrics?
They are numbers that show how well employees turn time, skills and resources into useful work. Common ones include output per employee, task completion rate, utilization, quality score and goal achievement.
What is the best employee productivity KPI?
There is no single best KPI. Output per employee suits operations, billable hours suit service firms, and revenue suits sales. The best KPI links daily work to real business results.
How do you measure employee productivity?
Compare work output with resources such as time, labor or cost. Use several related metrics, such as task completion, quality and goals, instead of one number.
How do you measure remote employee productivity?
Focus on outcomes: goals met, tasks finished, quality and delivery. Time and activity data add context, but online activity alone gives a misleading picture.
How often should productivity metrics be reviewed?
Review operational metrics weekly and strategic ones monthly or quarterly. Avoid big decisions based on short-term ups and downs.
Was this helpful?
Share it with someone who still adds up hours by hand.