App Usage - Overview
The App Usage page provides a clear and structured view of how applications are used across your organization during tracked work time. This page helps you understand which apps are being used, by whom, and for how long, enabling better visibility into productivity patterns, work habits, and tool utilization.
Designed for both managers and organization owners, the App Usage page consolidates usage data into flexible views that can be analyzed by date, application, or team member. With built-in filters and export options, it allows you to review usage trends over a selected period and share insights with stakeholders when needed.
Overall, this page serves as a practical analytics layer that complements time tracking by answering an important question:
“How is tracked time actually being spent across different applications?”
Time & Activity Preview

Overview of Filter
The filter section at the top of the App Usage page helps you precisely control what data you want to analyze. It works as the primary control panel for narrowing down usage insights before they are reflected in the list and export results.
Date Range Filter
You can select a specific date range to view app usage data for a defined period. This allows you to analyze short-term behavior (such as a single day or week) or longer trends across weeks or months. Once the date range is updated, all usage calculations - total time, grouping, and exports - are refreshed automatically.
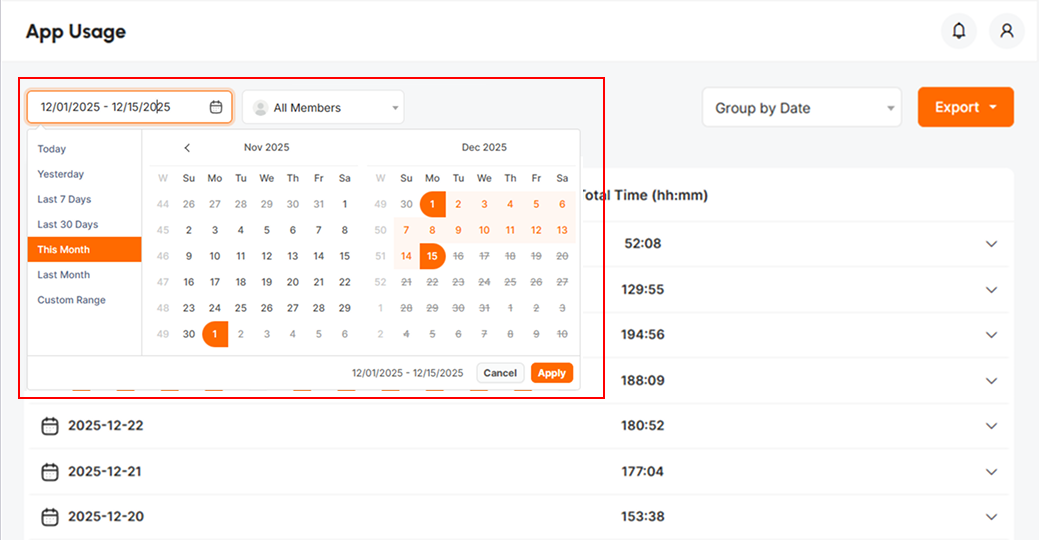
Member Filter
The member selector lets you focus on:
- All Members to see organization-wide app usage, or
- A specific member to analyze how an individual uses applications during the selected time period.

Group By Selector
The Group by option controls how the usage data is structured in the list:
-
Group by Date
Shows app usage summarized day by day. -
Group by App
Organizes data based on each application and its total usage. -
Group by Member
Displays usage grouped by individual members.

Export Access
The Export button remains available alongside the filters, ensuring that whatever filtered and grouped data you are viewing can be downloaded instantly in the required format.

Group by Date List
When Group by Date is selected, the App Usage list presents application usage in a clear, time-based hierarchy. This view is designed to help you understand which apps were used on a specific day and who used them, along with the total time spent.
Data hierarchy in this view follows three levels:
The member selector lets you focus on:
-
Date (Top level)
Each date represents a single working day within the selected date range. At this level, you see the total app usage time accumulated by all members for that day. -
App (Second level)
Expanding a date reveals the list of applications used on that day (e.g., Google Chrome, VS Code, Slack). Each app row shows the total time spent on that application across all members for the selected date. -
Member (Third level)
Expanding an app displays the individual members who used that application on that day. For each member, the list shows the exact time spent using that app, helping identify usage distribution within the team.

Why this view is useful
- Helps analyze daily application usage patterns.
- Provides visibility into who is using which app and for how long.
- Makes it easy to spot most-used apps per day.
- Useful for productivity reviews, software usage audits, and optimization decisions.
Group by App List
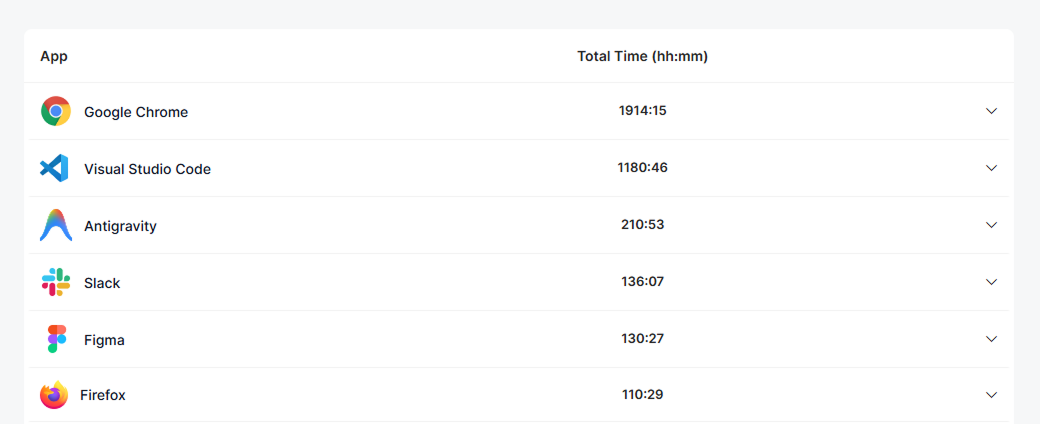
The Group by App view reorganizes App Usage data to help you understand how each application is used across your team, who is using it, and on which dates. Instead of starting from dates, this view starts with the application itself and then drills down into usage details.
In this mode, the data hierarchy follows this structure:
- App → Member → Date
This means each application becomes the top-level row, making it easy to identify the most-used or least-used apps within the selected time range.
How it works in practice:
-
At the top level, you see a list of applications (for example, Google Chrome, Visual Studio Code, Slack), each showing the total time spent on that app.
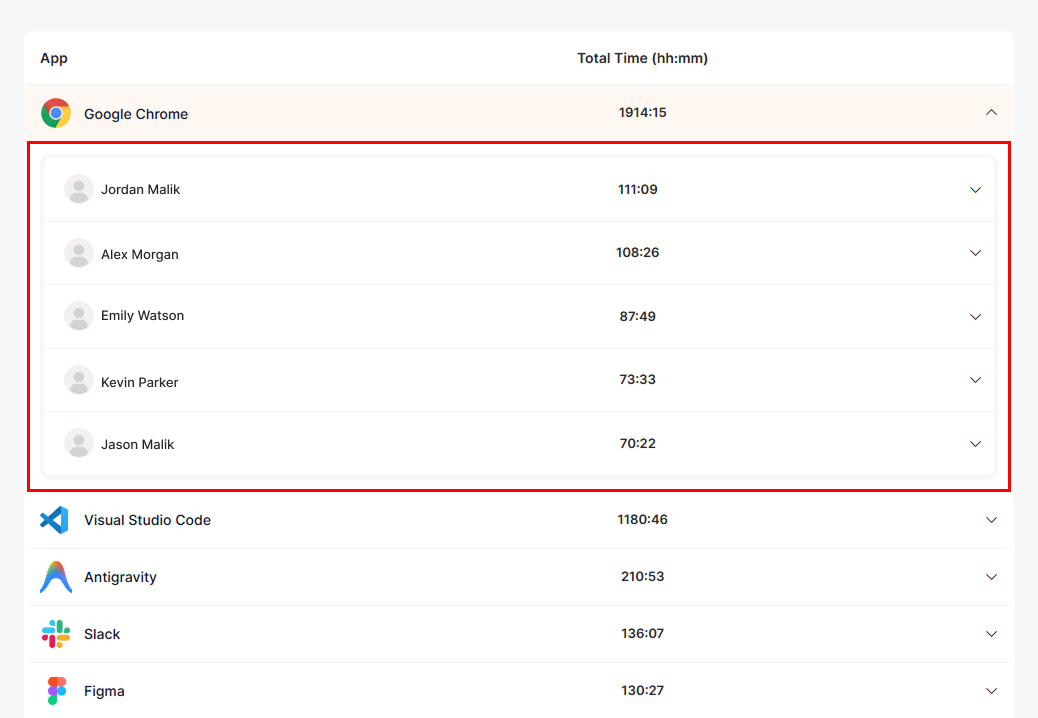
-
Expanding an app reveals the members who used it, along with the time each member spent using that specific application.
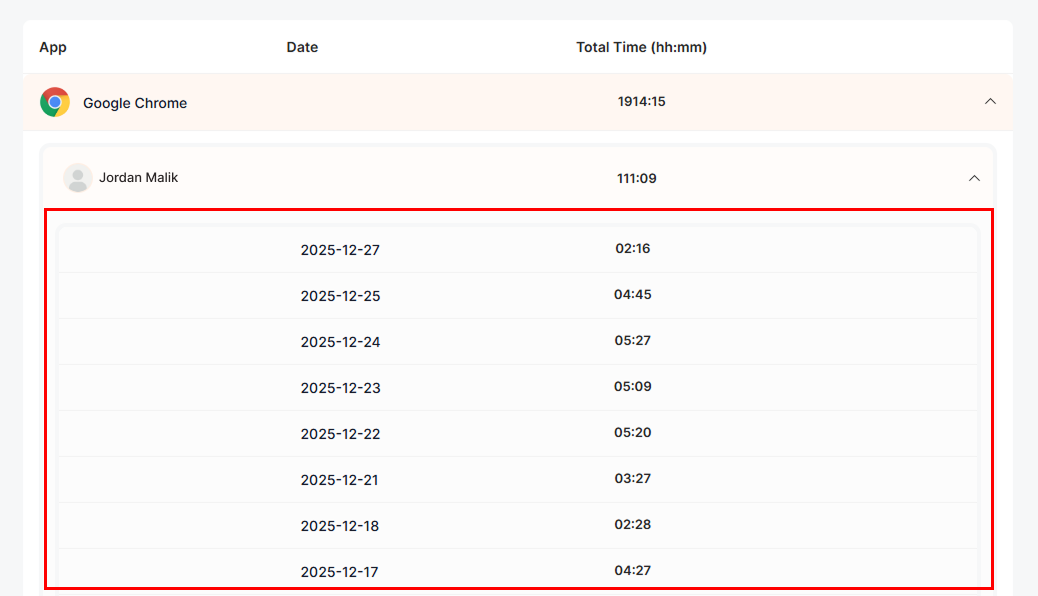
-
Expanding a member further shows a date-wise breakdown, displaying on which days the app was used and for how long.
This grouping is especially useful when you want to:
- Analyze tool adoption across the organization.
- Identify which team members are spending the most time on specific apps.
- Detect productivity patterns, such as excessive time on non-work-related applications.
- Support compliance or internal audits by tracing app usage down to individual dates.
Overall, Group by App provides a clear, application-centric perspective that complements date-based and member-based views, giving managers deeper insight into how software tools are actually used in daily work.
Group by Member List
The Group by Member view reorganizes App Usage data around individual team members, making it easy to understand how each person spends their time across different applications and dates. This perspective is especially useful for performance reviews, workload analysis, and identifying usage patterns at an individual level.
In this mode, the data hierarchy follows this structure:
- Member → App → Date
Here's how the data flows:
-
Member (Top Level):
Each row starts with a team member. This gives you a clear, person-centric overview of application usage within the selected date range.
-
App (Second Level):
Expanding a member shows the list of applications they used. For each app, the total time spent by that member is displayed, helping you quickly identify which tools dominate their workflow.
-
Date (Third Level):
Expanding an app further reveals a date-wise breakdown, showing exactly when the member used that specific application and for how long on each day.
This grouping is particularly helpful when you want to:
- Review how a specific employee distributes time across different apps
- Compare app usage habits between team members
- Trace usage patterns of a member over multiple days without switching views
Overall, Group by Member provides a focused, drill-down-friendly view that turns raw app usage data into clear, actionable insights at the individual level.
Export (PDF & CSV)
The Export feature in the App Usage page allows you to download usage data in a structured format for reporting, sharing, or offline analysis. You can export the data at any time after applying your preferred date range, member filter, and grouping option.
When you click the Export button, TimoDesk first asks you to choose the export format PDF or CSV.
- PDF is best for presentations, reviews, and sharing with stakeholders.
- CSV is suitable for spreadsheets, further analysis, or integration with external tools.
Expanded Export
The expanded export includes all nested levels of the list exactly as they appear when fully expanded on the screen. This means:
- All parent and child rows are included (for example, Date → App → Member, or Member → App → Date).
- Each breakdown level is preserved, providing a complete, detailed view of app usage.
- This option is ideal for audits, in-depth analysis, and detailed reporting.

Non-Expanded (Collapsed) Export
The non-expanded export downloads only the top-level summary data:
- Child rows are excluded from the file.
- The export focuses on totals and high-level usage figures based on the selected grouping.
- This option is best for quick summaries, executive reports, or when you need a clean overview without granular details.

Once the export type is selected, clicking Download generates the file instantly based on your current filters and grouping, ensuring the exported data always matches what you are analyzing on the screen.