The team dashboard managers open first
The TimoDesk team dashboard shows who worked when and who is online now, then lists what needs your attention, so remote managers know where to start each morning.
Team dashboard
Your team's day on one page
Most managers start the day with the same question: who is working, and what needs me? The team dashboard answers it on one page, for the range you pick. It is part of the one plan at $1 per user per month, and it suits remote teams and managers watching for burnout on long days. For step-by-step help, see the Dashboard guide.
Team Day
See who worked and when
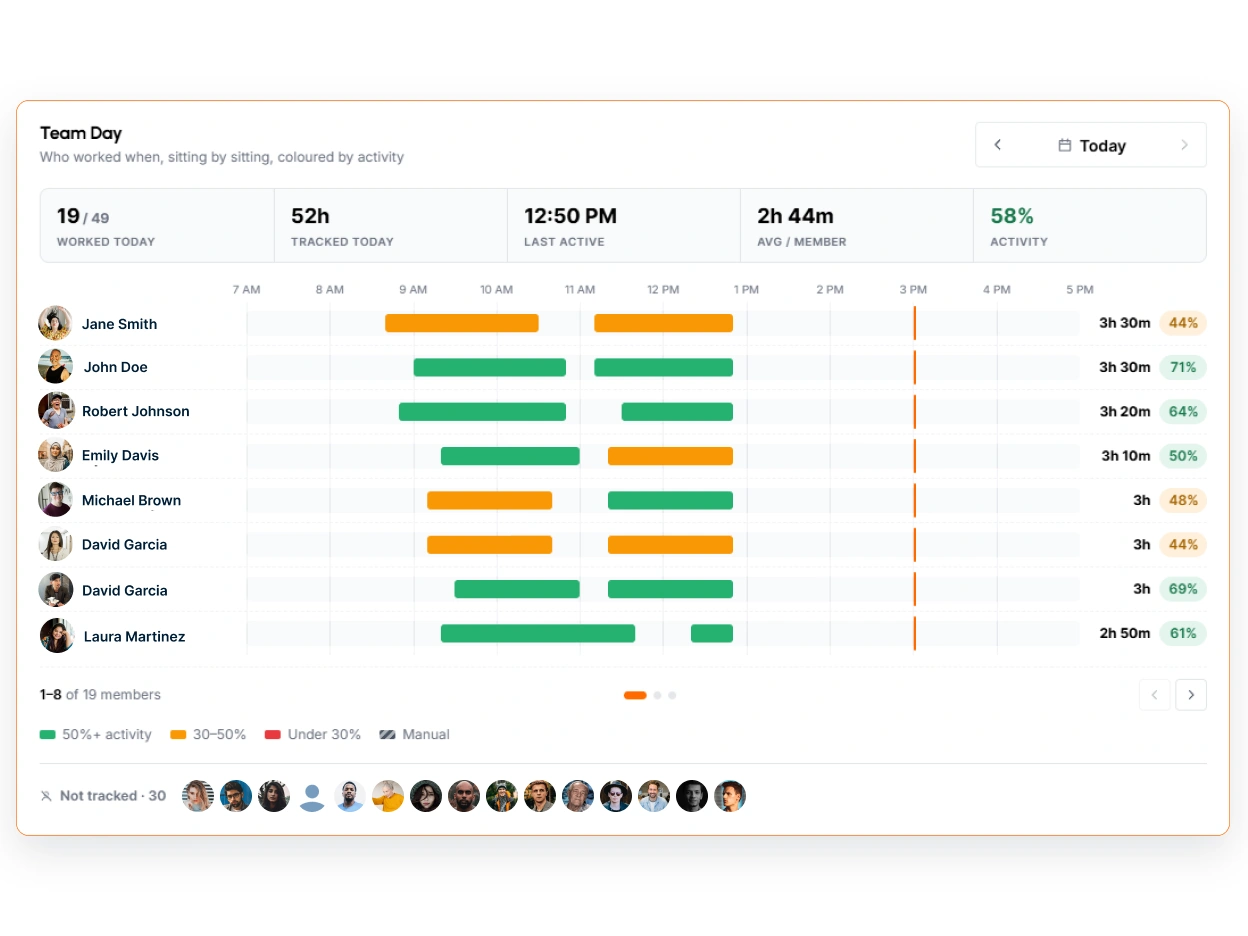
Six key figures open the page: hours tracked, average activity, members active, the average day per member, idle share and tasks completed. Each one shows its trend across the range. Below them, the Team Day timeline draws each member's day as a row of work sessions.
- Each session is colored by activity: 50% and up, 30 to 50%, or under 30%
- Manual time has its own color, so it never passes for tracked time
- Members with tracking on who recorded nothing are listed as not tracked
- Step back through earlier days with the arrows
- Live Now shows who is online, with their project and task
Performance Map
Where each member stands
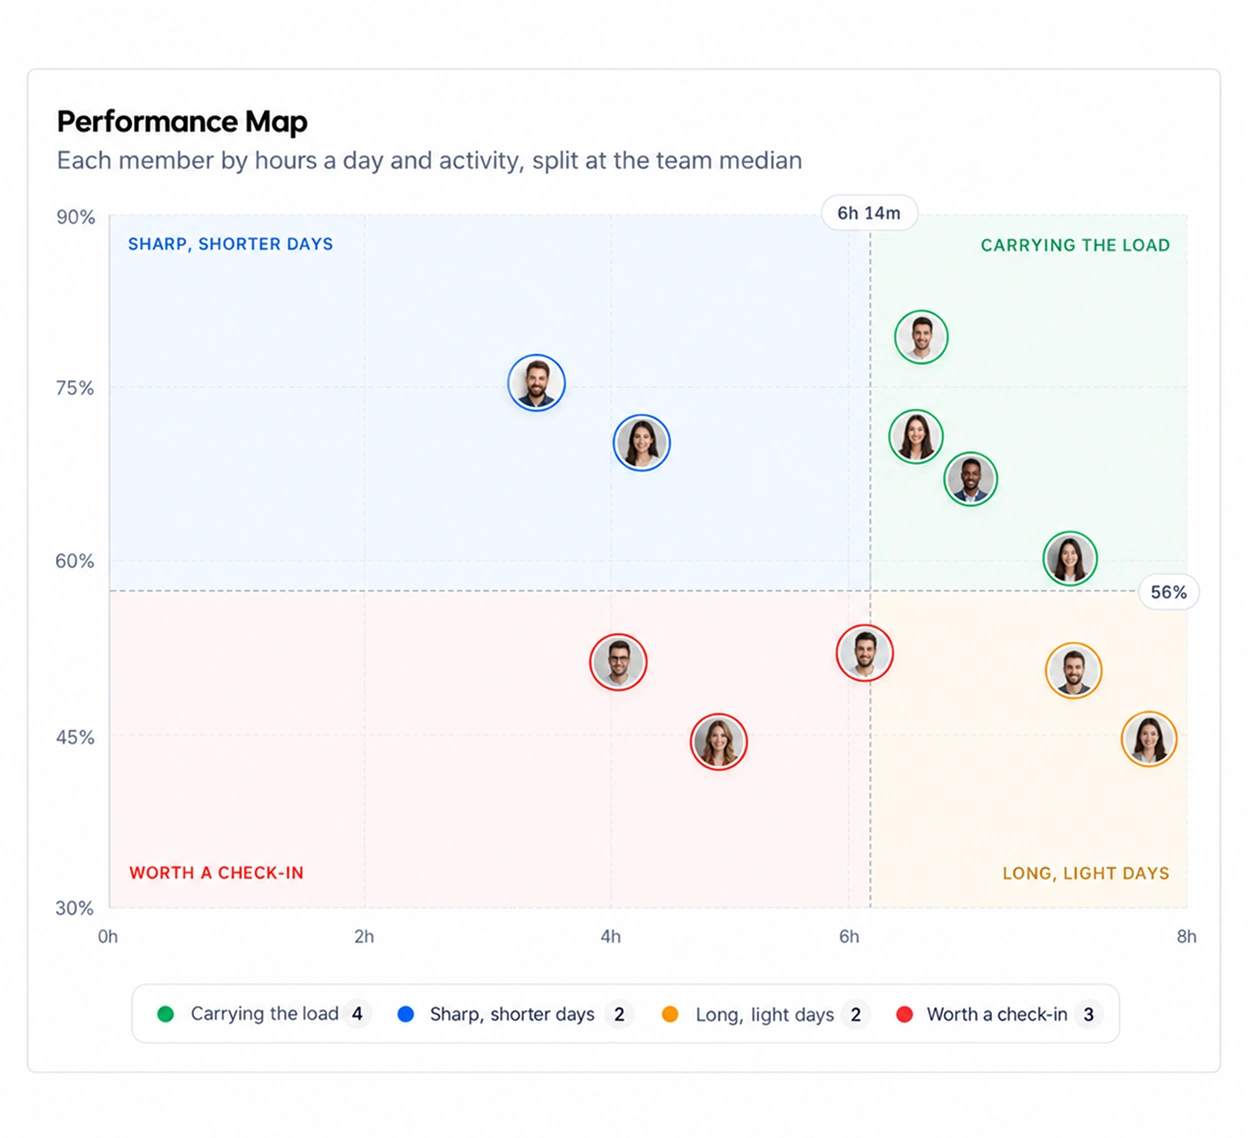
The performance map places each member by hours a day and average activity. It splits the team at the median of both, so every member lands in one of four groups. Hover over a member to see their numbers and how they changed from the period before.
- Carrying the load: longer days, higher activity
- Sharp, shorter days: shorter days, higher activity
- Long, light days: longer days, lower activity
- Worth a check-in: shorter days, lower activity
Compared with your own team
The split is your team's median, not a fixed target. A member needs at least an
hour tracked in the range to be placed. Time Allocation, next to it, shows how
the hours split across your top projects, day by day.
Action Center
What needs you, worst first
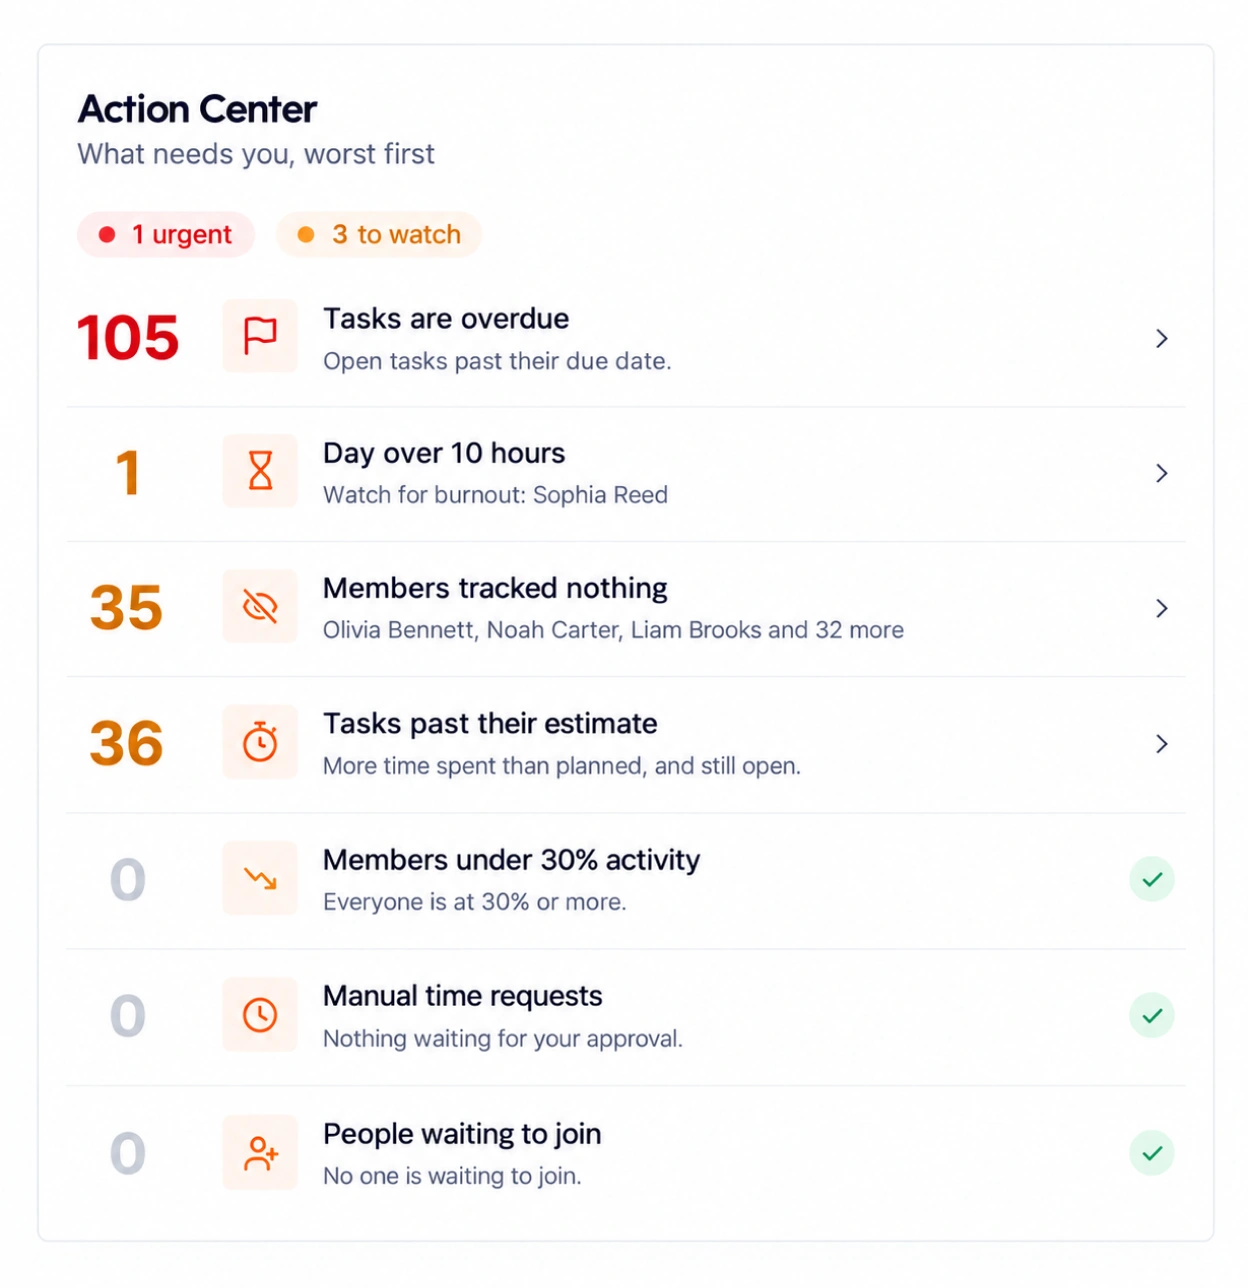
The Action Center runs a set of checks on the range you picked. Checks that found something come first. Open one to see the list behind the number, with each row linking to its task, member or request.
- Open tasks past their due date
- Members under 30% activity, once they have an hour tracked
- Workdays longer than 10 hours
- Members with tracking on who tracked nothing
- Open tasks that used more time than estimated
- Manual time requests waiting for your approval
- People who asked to join, for organizers and managers
Exports live in the reports
The dashboard is for today and the weeks around it. For PDF and CSV exports
and the daily and weekly summary emails, see reports and analytics.
Roles and ranges
One range, and what each role sees
The dashboard opens on the last 15 days. Pick another range at the top, from today to this year, and every card follows it. Charts show days for ranges up to a month, then weeks, then months. What each person sees depends on their role.
| On the dashboard | Organizer | Manager | Team manager | Member |
|---|---|---|---|---|
| Key figures | Everyone | Everyone | Their teams | Their own |
| Team Day timeline | Everyone | Everyone | Their teams | My Day |
| Live Now | Everyone | Everyone | Their teams | |
| Time Allocation | Everyone | Everyone | Their teams | Their own |
| Top apps and websites | Everyone | Everyone | Their teams | Their own |
| Performance Map | Everyone | Everyone | Their teams | |
| Action Center | Their teams | |||
| People waiting to join | ||||
| Activity heatmap, My Tasks, recent screenshots |
A team manager's view covers their own time and the teams they manage. Members get their own dashboard with My Day in place of the Team Day, plus an activity heatmap, the tasks their time went to and their latest screenshots.
Questions
About the team dashboard
What the dashboard shows, who sees it, and where the reports take over.
What is the TimoDesk team dashboard?
It is the home page of your TimoDesk dashboard. Organizers, managers and team managers see their team's hours, activity, who is online and what needs attention, all for the date range they pick.
What does the Action Center flag?
It flags overdue tasks, members under 30% activity, days over 10 hours, members with tracking on who tracked nothing, open tasks past their estimate and manual time waiting for your approval. Organizers and managers also see people waiting to join.
How does the performance map place each member?
It places each member by hours a day and average activity, then splits the team at the median of both. Anyone with at least an hour tracked in the range is placed, and the map needs two such members to draw.
Can a team manager see the whole organization?
No. A team manager sees their own time and the members of the teams they manage. Organizers and managers see everyone in the organization.
What do members see on their dashboard?
Members see their own time only. They get My Day, their key figures, top apps and websites, time by project, an activity heatmap, their tasks and their latest screenshots.
Can I export the dashboard or get it by email?
No. The dashboard is the daily view. For PDF and CSV exports and the daily and weekly summary emails, use the reports.
More features
More TimoDesk features
Each feature has its own page that explains what it does and what it doesn't do. All of them are on the same plan.
- Time tracking Time tracked while the work happens
- Project management Kanban boards with time on every card
- Project time tracking Every hour saved to its project and task
- Manual time Request and approve time the app missed
- Time calendar Each member's hours by day, week and month
- Screenshots Screenshots linked to each task
- Activity levels Keyboard and mouse activity, never keystrokes
- App and website usage Which apps and websites were used
- Timesheets and exports Monthly timesheets you can bill from
Start tracking time this week
Create your organization and invite your team today. Tracked time shows on the dashboard the same day, and the first full-day reports are ready the next day. $1 per user per month, with every feature included.
- $1 per user / month
- 15-day free trial, no card
- Stop anytime. No contract.
